Flutter DevTools is a set of developer tools created specifically for the Flutter framework. It is a tool that assists developers in creating, debugging, and optimizing applications written in Flutter. It offers a range of features for analyzing, monitoring, and managing the state and performance of applications.
Here are some key features of Flutter DevTools:
- Debugger: Flutter DevTools is a set of tools for debugging and profiling Flutter applications.
- Flutter Inspector: Flutter Inspector is a tool in Flutter DevTools that allows real-time inspection of the widget tree.
- Performance: Shows information about the application’s performance, such as frame rendering time.
- CPU Profiler: Allows analysis of CPU usage by the application. You can see which functions consume the most resources.
- Memory: Displays how much memory the application is using, with detailed information on memory allocation and deallocation.
- Network: Provides detailed information about the network, such as HTTP and WebSocket requests.
- Logging: The Logging tool in Flutter DevTools is used for monitoring and filtering logs generated by the Flutter application.
- App Size: A tool for analyzing file size and comparing changes between old and new versions.
Flutter DevTools can be launched as a standalone application or integrated directly into developer tools in the working environment, such as Visual Studio Code or Android Studio. This provides developers with full access to advanced analysis and debugging features, making it easier to develop efficient and stable Flutter applications.
Flutter offers three runtime modes for running applications: debug, profile, and release. Each is intended for different purposes:
- Debug: This is the default mode when running your application locally on an emulator or device. In debug mode, Flutter enables the use of debugging tools such as hot reload and step-through debugger. Applications run in debug mode are typically slower than those run in release mode.
- Profile: This mode is designed for profiling the performance of the application. It is similar to debug mode, but some debugging features are disabled, allowing for more accurate performance measurements. In profile mode, Flutter collects performance data that can be analyzed using tools like Flutter DevTools.
- Release: This is the mode in which your application should be run when it is ready for distribution to users. In release mode, Flutter optimizes your application for the best performance and smallest size. Debugging features are disabled in this mode.
Debugger
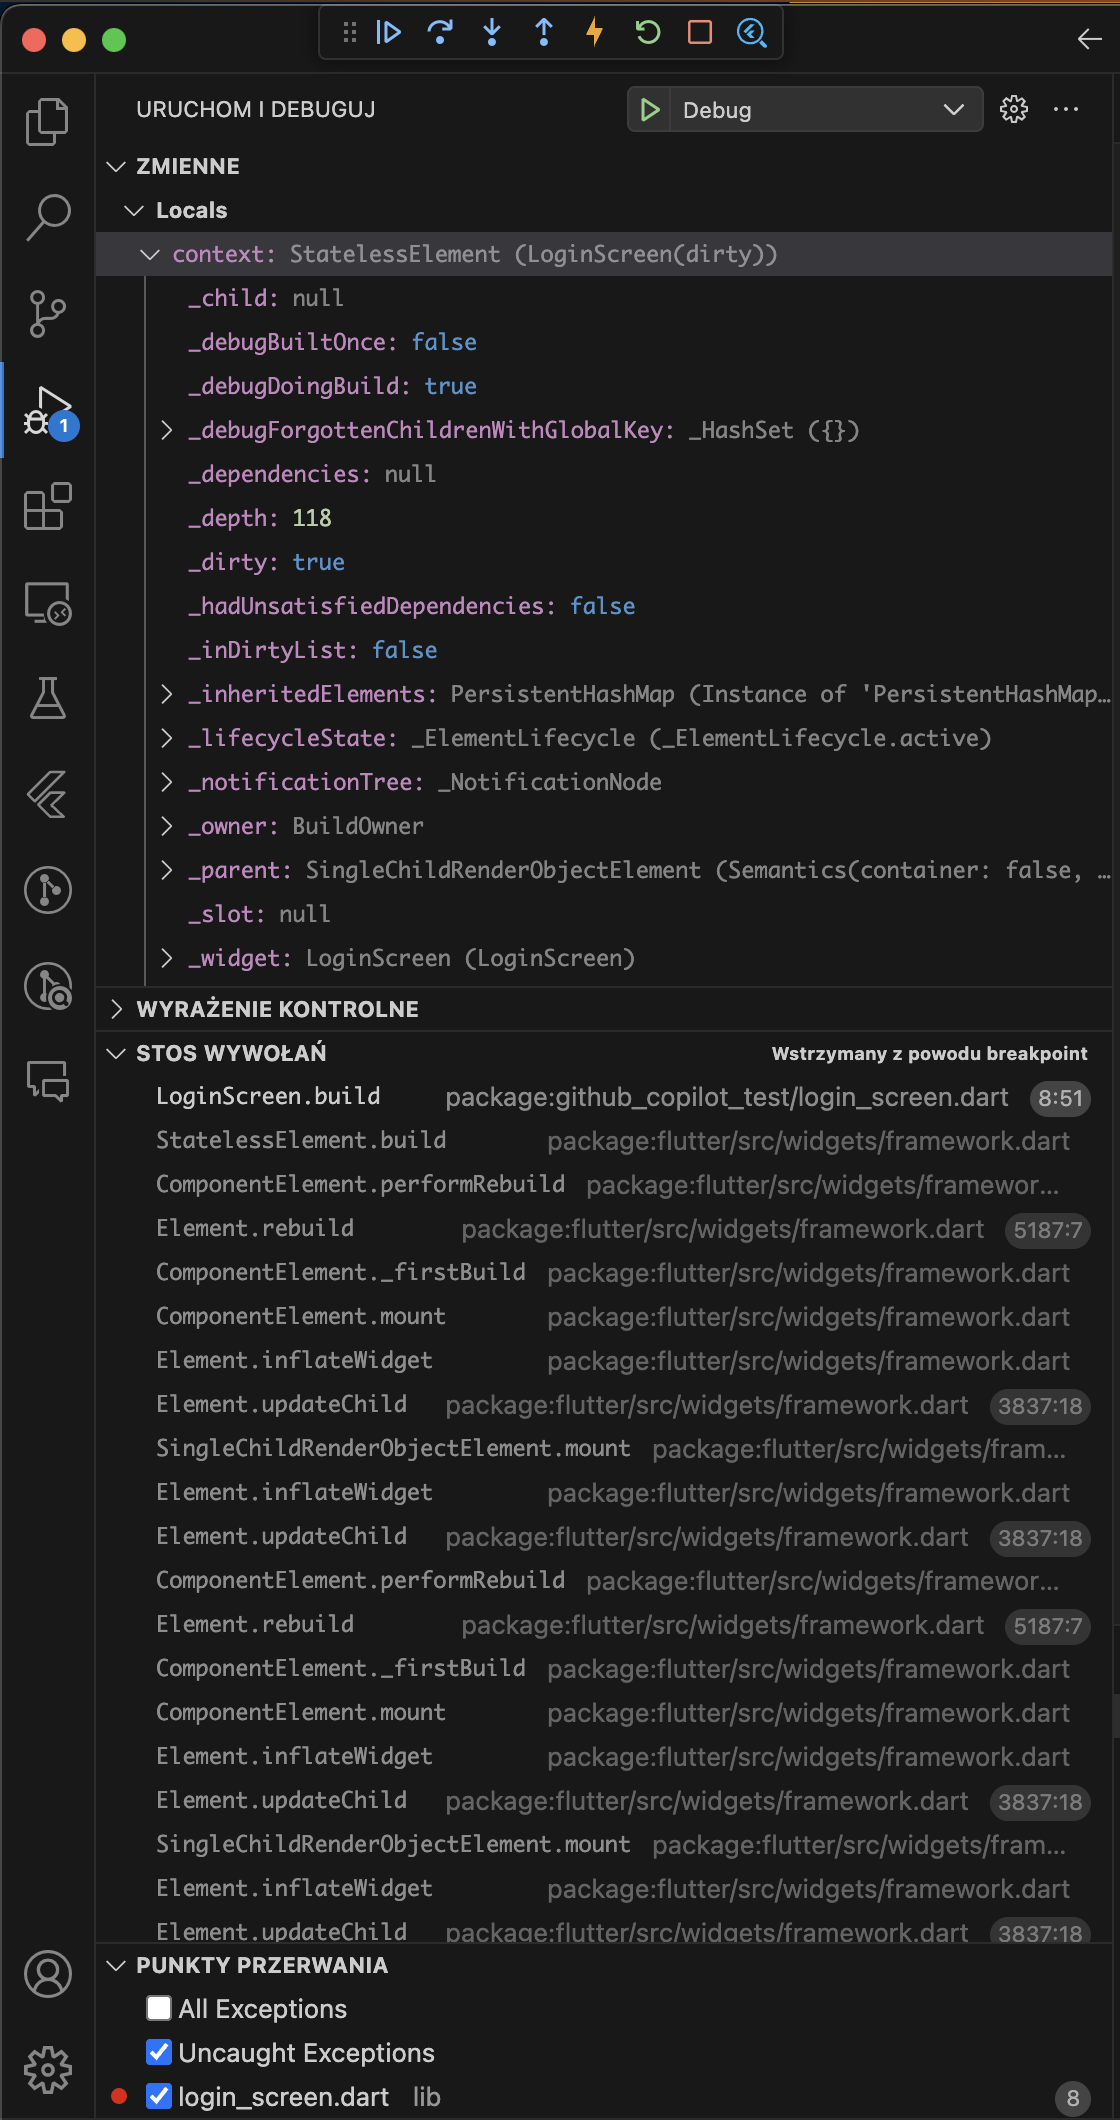
Flutter DevTools is a set of debugging and profiling tools for Flutter applications. The debugger in Flutter DevTools allows you to:
- Browse source code: You can directly browse the source code of your application within DevTools.
- Set breakpoints: You can set breakpoints in the source code to pause the execution of the program at a specific location.
- Step by step: You can control the execution of the program step by step, going through each line of code.
- Variable inspection: You can check the value of variables in real-time during program execution.
- Call stack: You can inspect the call stack to see which functions were called to reach the current point in the program.
- Exceptions: You can view exceptions thrown by the program.
Remember that to use the Flutter DevTools debugger, you need to first run your application in debug mode.
Flutter Inspector
Flutter Inspector is a tool available in Flutter DevTools that assists in visualizing and exploring the widget tree in Flutter applications.
models
The tool allows you to activate the following modes:
a) Select Widget Mode – Upon choosing this mode, you can click and select items on the emulator/physical device that interest you. Focus will be set on these items, and you can see their details, such as margins and paddings. Additionally, the tool will open the corresponding file where this widget is used.
b) Slow Animations – The “Slow Animations” option in Flutter DevTools enables slowing down the pace of animations, facilitating precise debugging for developers. It aids in analyzing animation performance and identifying potential issues related to their operation.
c) Show Guidelines – Displays directional lines on the application interface, making it easier for developers to establish and maintain consistency in the layout of widgets. These lines assist in precisely placing elements and adjusting them to specific directions, enhancing visual uniformity in the user interface.
d) Show Baselines – When this option is enabled, baselines for text are displayed on the screen. The baseline is the line on which text is placed. In typography, the baseline is the line on which letters “stand.” For example, for letters like “a” or “e,” the bottom edge of the letter is placed on the baseline. Yellow indicates how low descenders of text go, e.g., for letters: y, j, ę, etc.
e) Highlight Repaints – The “Highlight Repaints” option in the Widget Inspector in Flutter is a debugging tool that helps understand which widgets are repainted (i.e., redrawn) in each rendering cycle. When this option is enabled, each widget being repainted is surrounded by a border that changes color with each rendering cycle. This makes it easy to see which widgets are being repainted, aiding in identifying performance issues.
f) Highlight Oversized Images – This is a debugging tool that helps identify images that are too large for their rendering container. When this option is enabled, images larger than their rendering container are highlighted in blue. This means the image is taking up more memory than necessary, potentially leading to unnecessary memory consumption and impacting application performance.
Widget Tree in flutter
The Widget Tree in Flutter DevTools is a tool that displays the widget structure in your Flutter application. This is a highly useful tool for understanding the hierarchy and structure of widgets in your application.
Here are some key features of the Widget Tree:
- Widget Hierarchy: The Widget Tree reveals how widgets are nested in your application. You can see which widget serves as the parent to another widget, aiding in understanding their interrelationships.
- Widget Details: When you click on a widget in the Widget Tree, you can view detailed information about that widget, such as its type, properties, and state.
- Code Navigation: Clicking on a widget in the Widget Tree automatically navigates DevTools to the location in the code where that widget is defined. This is particularly useful for quickly locating and editing the code of a specific widget.
- Filtering and Sorting: You can filter and sort widgets in the Widget Tree, helping to understand which widgets are the most crucial or potentially problematic.
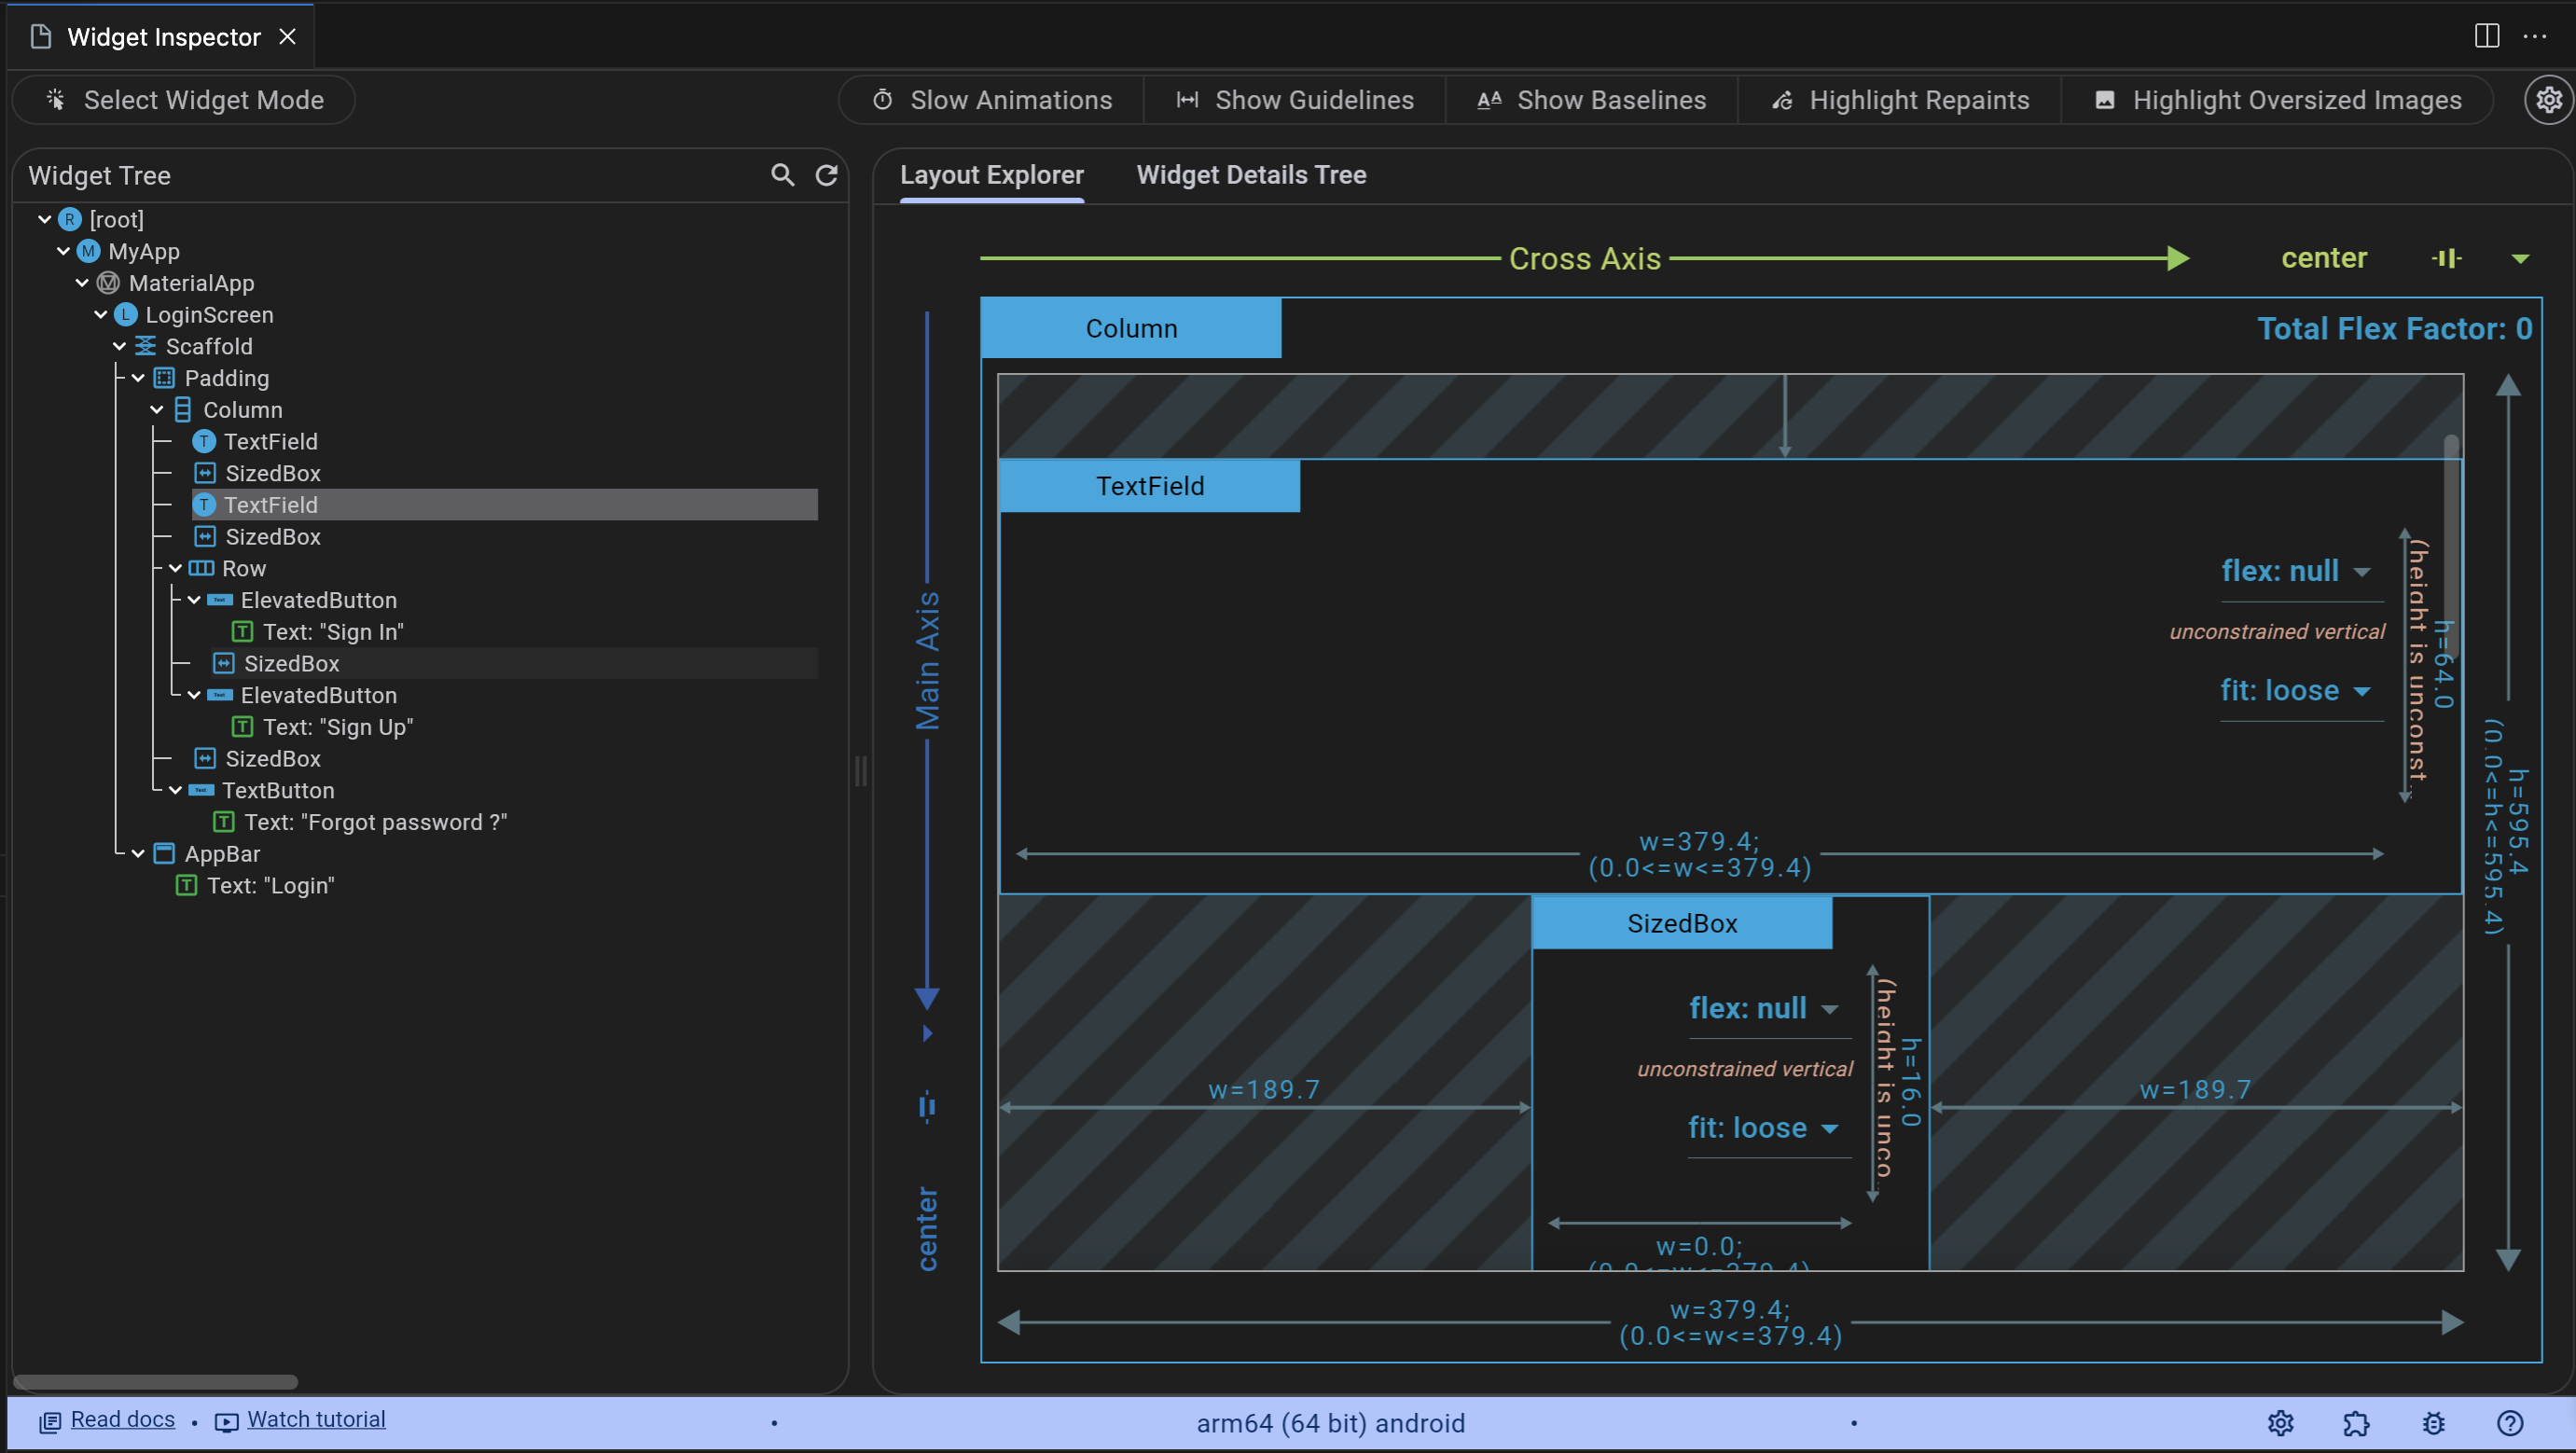
Layout Explorer
Layout Explorer in Flutter DevTools is a tool designed to help you understand and debug the layout of widgets in your Flutter application. It proves especially useful when working with Flex widgets such as Row, Column, and Flex.
Here are some key features of Layout Explorer:
- Visualization of the Layout: Layout Explorer provides a visualization of the layout of the selected widget. You can see how space is distributed among various widgets in Row, Column, or Flex.
- Property Manipulation: You can manipulate various layout properties, such as flex factor and fit, directly in Layout Explorer. Changes are reflected in real-time in your application.
- Understanding Overflow Errors: Layout Explorer can assist in understanding why overflow errors occur. It shows which widget exceeds the available space and by how much.
- Detailed Layout Information: Layout Explorer displays detailed information about the layout of the selected widget, including size, position, margins, padding, etc.
Widget Details Tree
Widget Details Tree in Flutter DevTools is a tool that provides detailed information about the selected widget. When you choose a widget in the Widget Tree, the details of that widget are displayed in the Widget Details Tree.
Here are some key features of Widget Details Tree:
- Detailed Widget Information: Widget Details Tree shows comprehensive details about the selected widget, such as its type, properties, and state.
- Widget Hierarchy: Similar to the Widget Tree, Widget Details Tree displays the hierarchy of widgets but focuses on the selected widget and its children.
- Widget Properties: You can view all the properties of the selected widget, including values, colors, padding, margins, etc.
- Widget State: If the selected widget is a StatefulWidget, Widget Details Tree will show its current state.
Performance
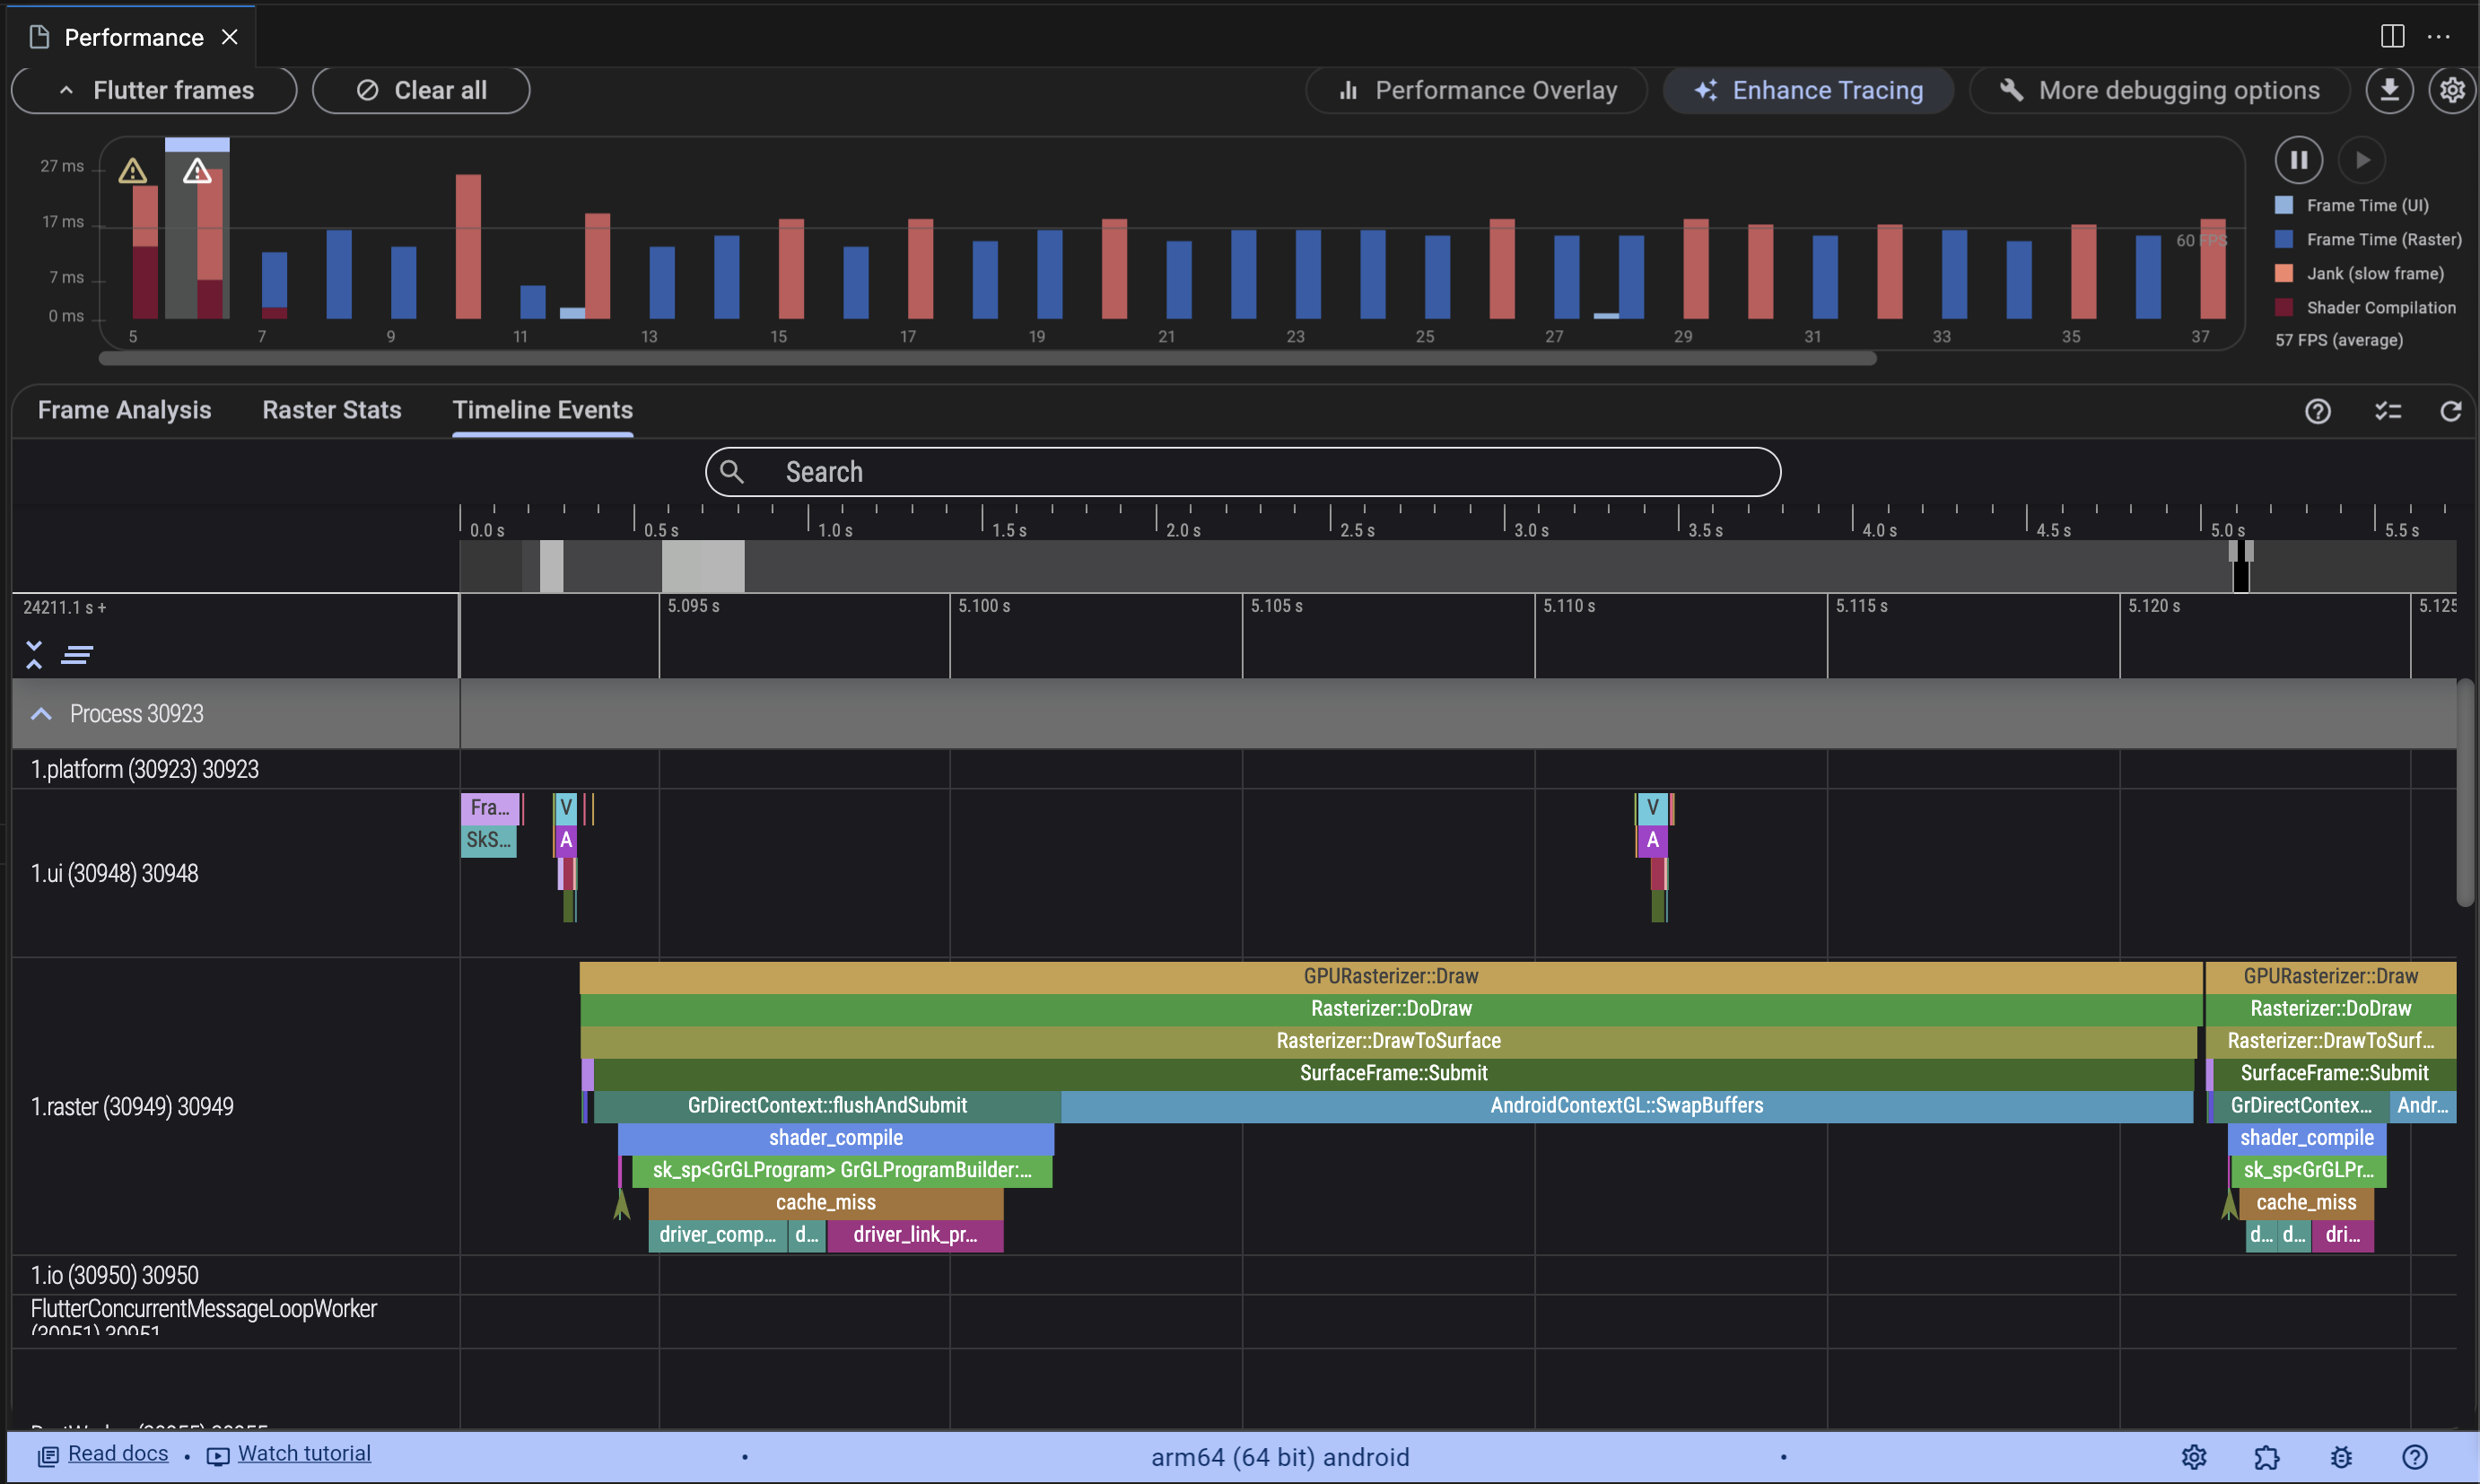
Performance in Flutter DevTools is a tool designed for monitoring the frame rendering time in an application, and it is ideally utilized in profiling mode. It allows you to check whether the rendering time for any frame exceeds the ideal value of 16ms (equivalent to 60 frames per second). If any frame surpasses this time, the Performance tool will notify you.
The tool presents a chart illustrating the rendering of individual frames along with the time required for each. By selecting a specific frame, additional information about it appears below the chart. This feature enables the identification and resolution of issues, such as screen stuttering, by providing insights into the rendering performance of frames.
Frame Analysis Tab
UI Phases:
- Build: The time required to construct the widget tree. In this phase, Flutter invokes the build methods for widgets that need updating.
- Layout: The time needed to calculate and assign sizes and positions for all widgets in the tree. In this phase, Flutter calls the layout methods for widgets that require updating.
- Paint: The time needed to draw widgets on the screen. In this phase, Flutter invokes the paint methods for widgets that need updating.
Raster Phases:
- Shader Compilation: The time required for shader compilation. Shaders are programs executed on the GPU for rendering graphics. Shader compilation can be time-consuming, so Flutter aims to precompile shaders wherever possible.
- Other Raster: The time needed for other rendering-related tasks, such as image composition, transformations, shading, and other GPU operations.
These metrics help understand where the application spends the most time during frame rendering, aiding in the identification and optimization of performance bottlenecks.
Raster Stats Tab
Upon clicking “Take Snapshot,” a snapshot of the current state of the application is created. Detailed information is provided regarding the rendering time of individual screen elements. This allows for an understanding of which components of the application require the most time for rendering, which can be helpful in optimizing performance.
Timeline Events Tab
The “Timeline Events” tab in Flutter DevTools provides a detailed view of all events that occurred during the frame lifecycle. Each event is represented as a bar on the timeline axis, enabling easy comprehension of when and for how long it occurred.
CPU Profiler
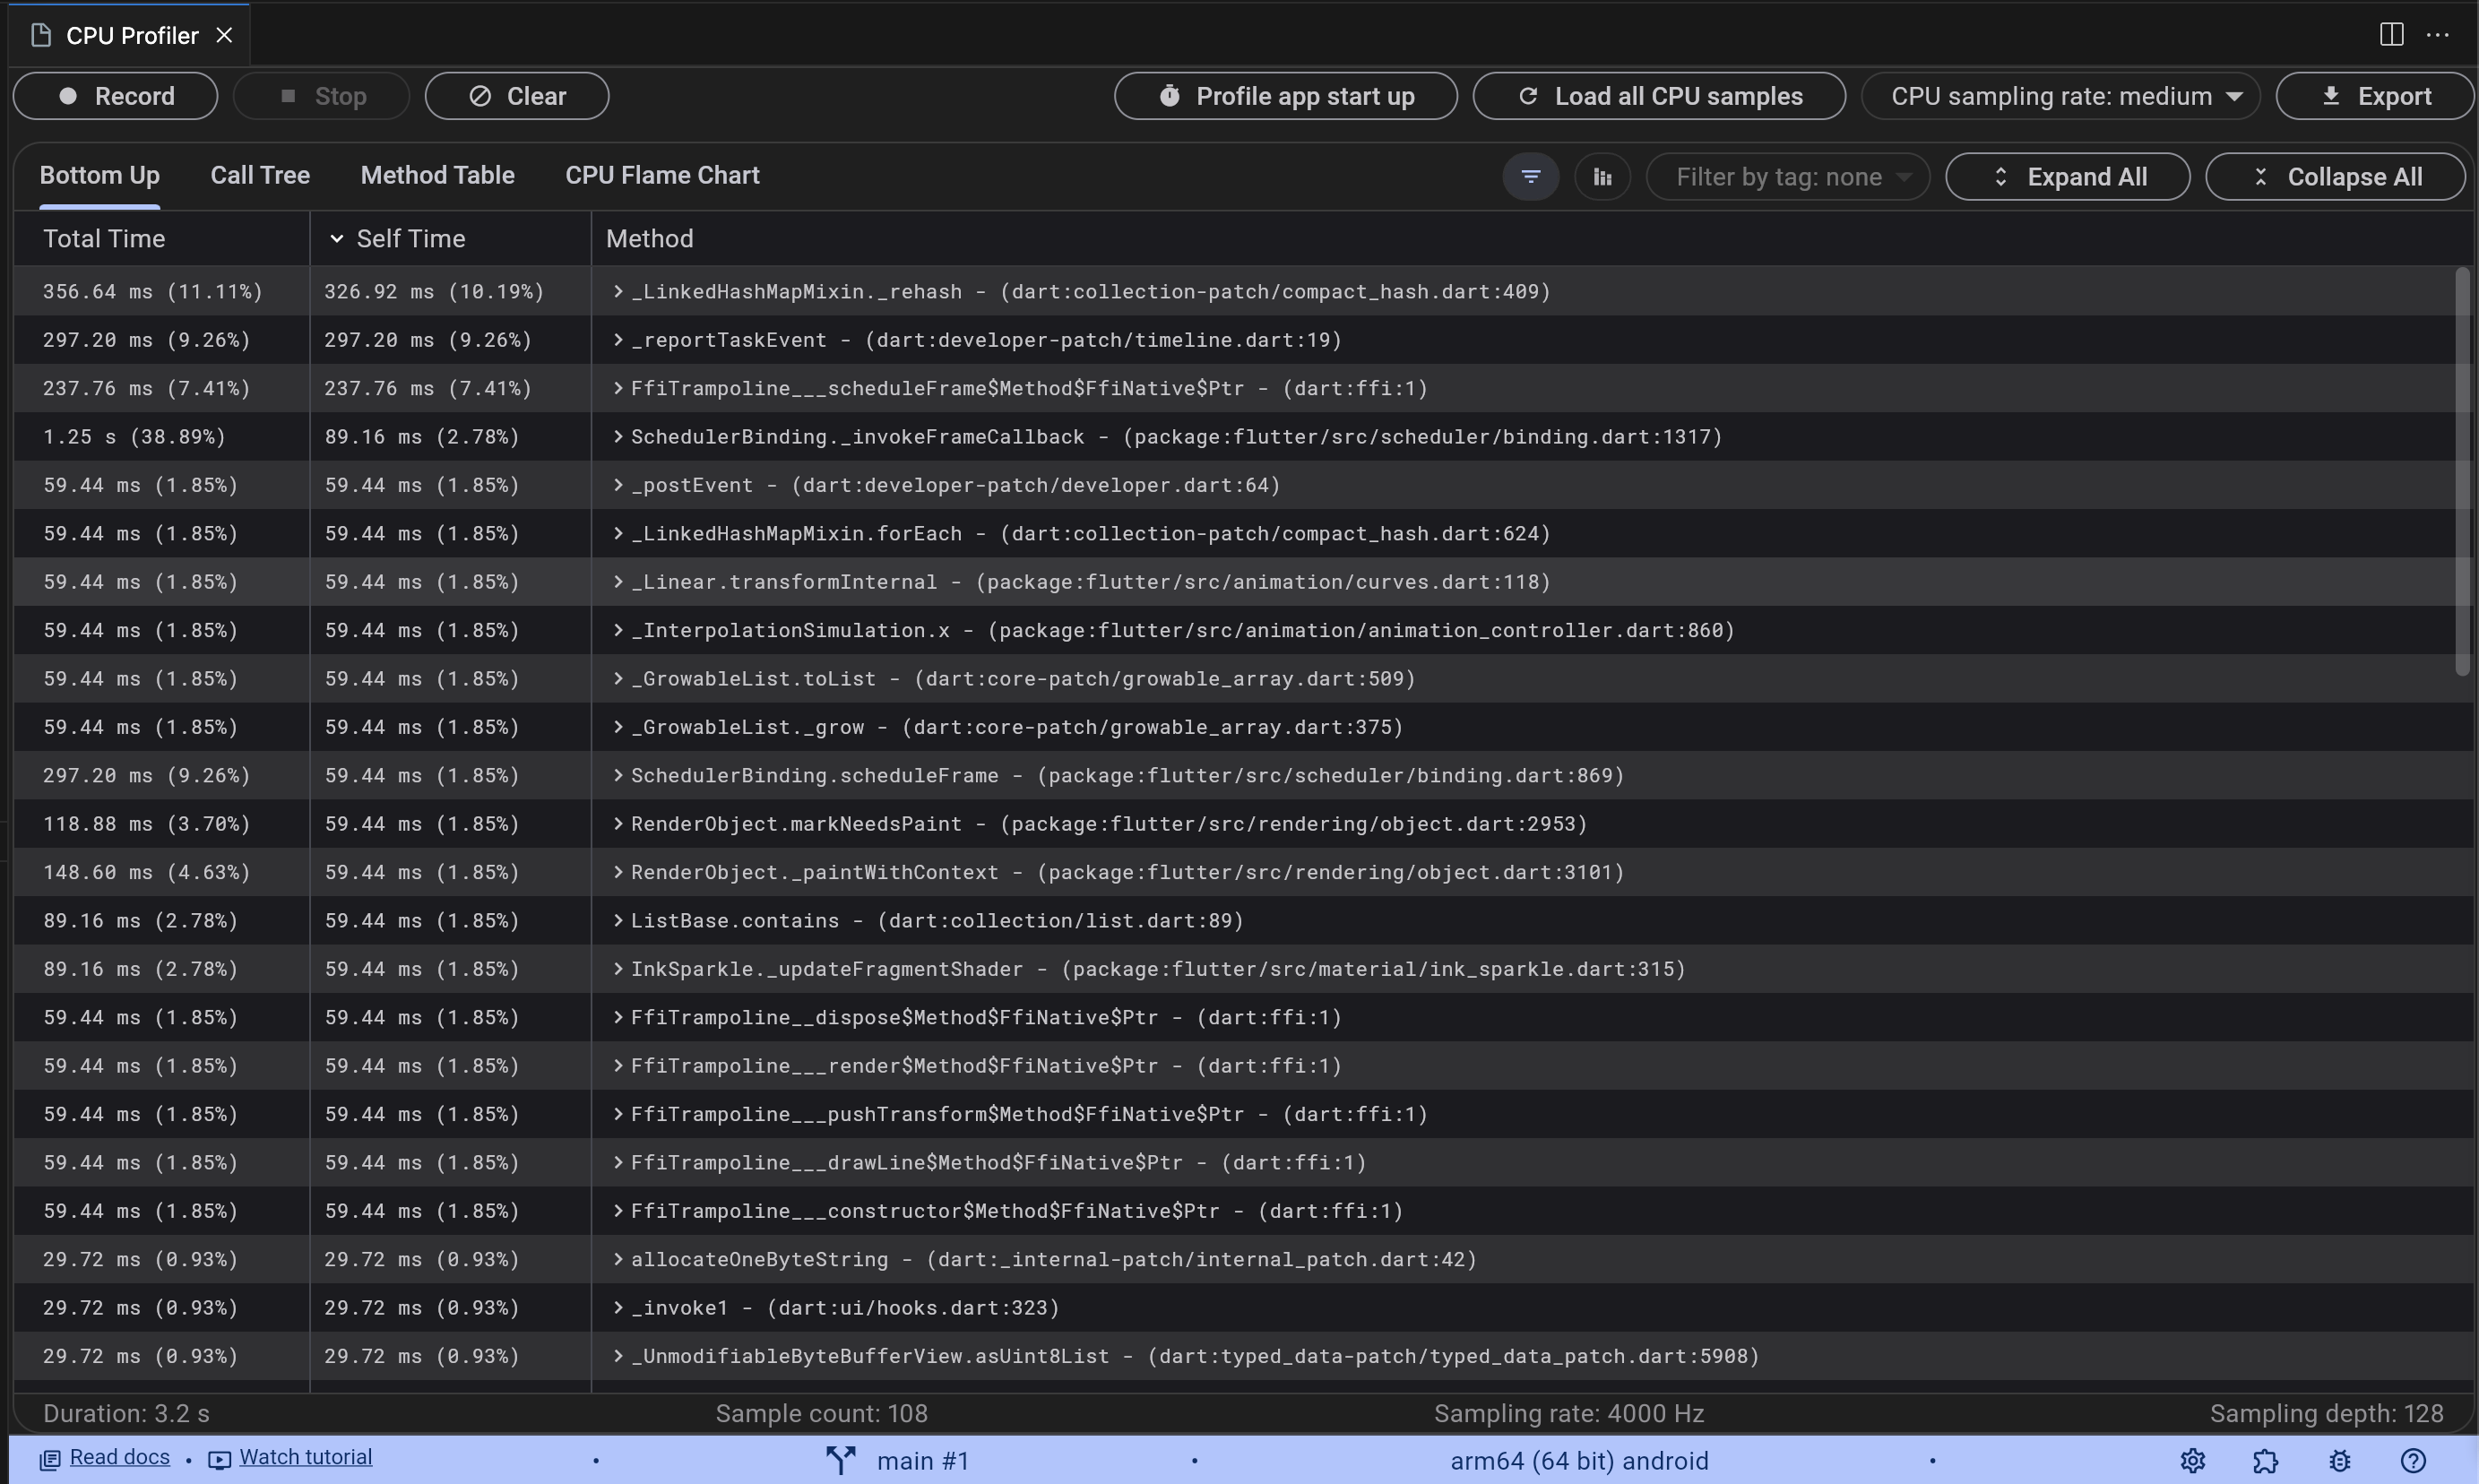
The “CPU Profiler” tab in Flutter DevTools provides detailed information about the application’s CPU usage. This allows for the identification of code areas that are most costly in terms of CPU utilization, aiding in performance optimization. Here’s what you can obtain from this tab:
- Bottom Up: A “bottom-up” view that shows which functions consumed the most CPU time by summing up all their occurrences. This is useful for identifying frequently invoked functions that may be performance bottlenecks.
- Call Tree: A call tree displaying the hierarchy of function calls. This helps understand which functions call other functions and how much CPU time is dedicated to each.
- Method Table: Contains a table of all methods called during profiling. Each row in the table represents a single method and is helpful in identifying methods that are most costly in terms of CPU usage. This can assist in optimizing application performance.
- CPU Flame Chart: A CPU flame chart visualizing the call stack for all CPU samples. Each function is represented as a bar on the chart, with its width corresponding to the time spent executing it. The higher the function on the chart, the deeper it is in the call stack.
Memory
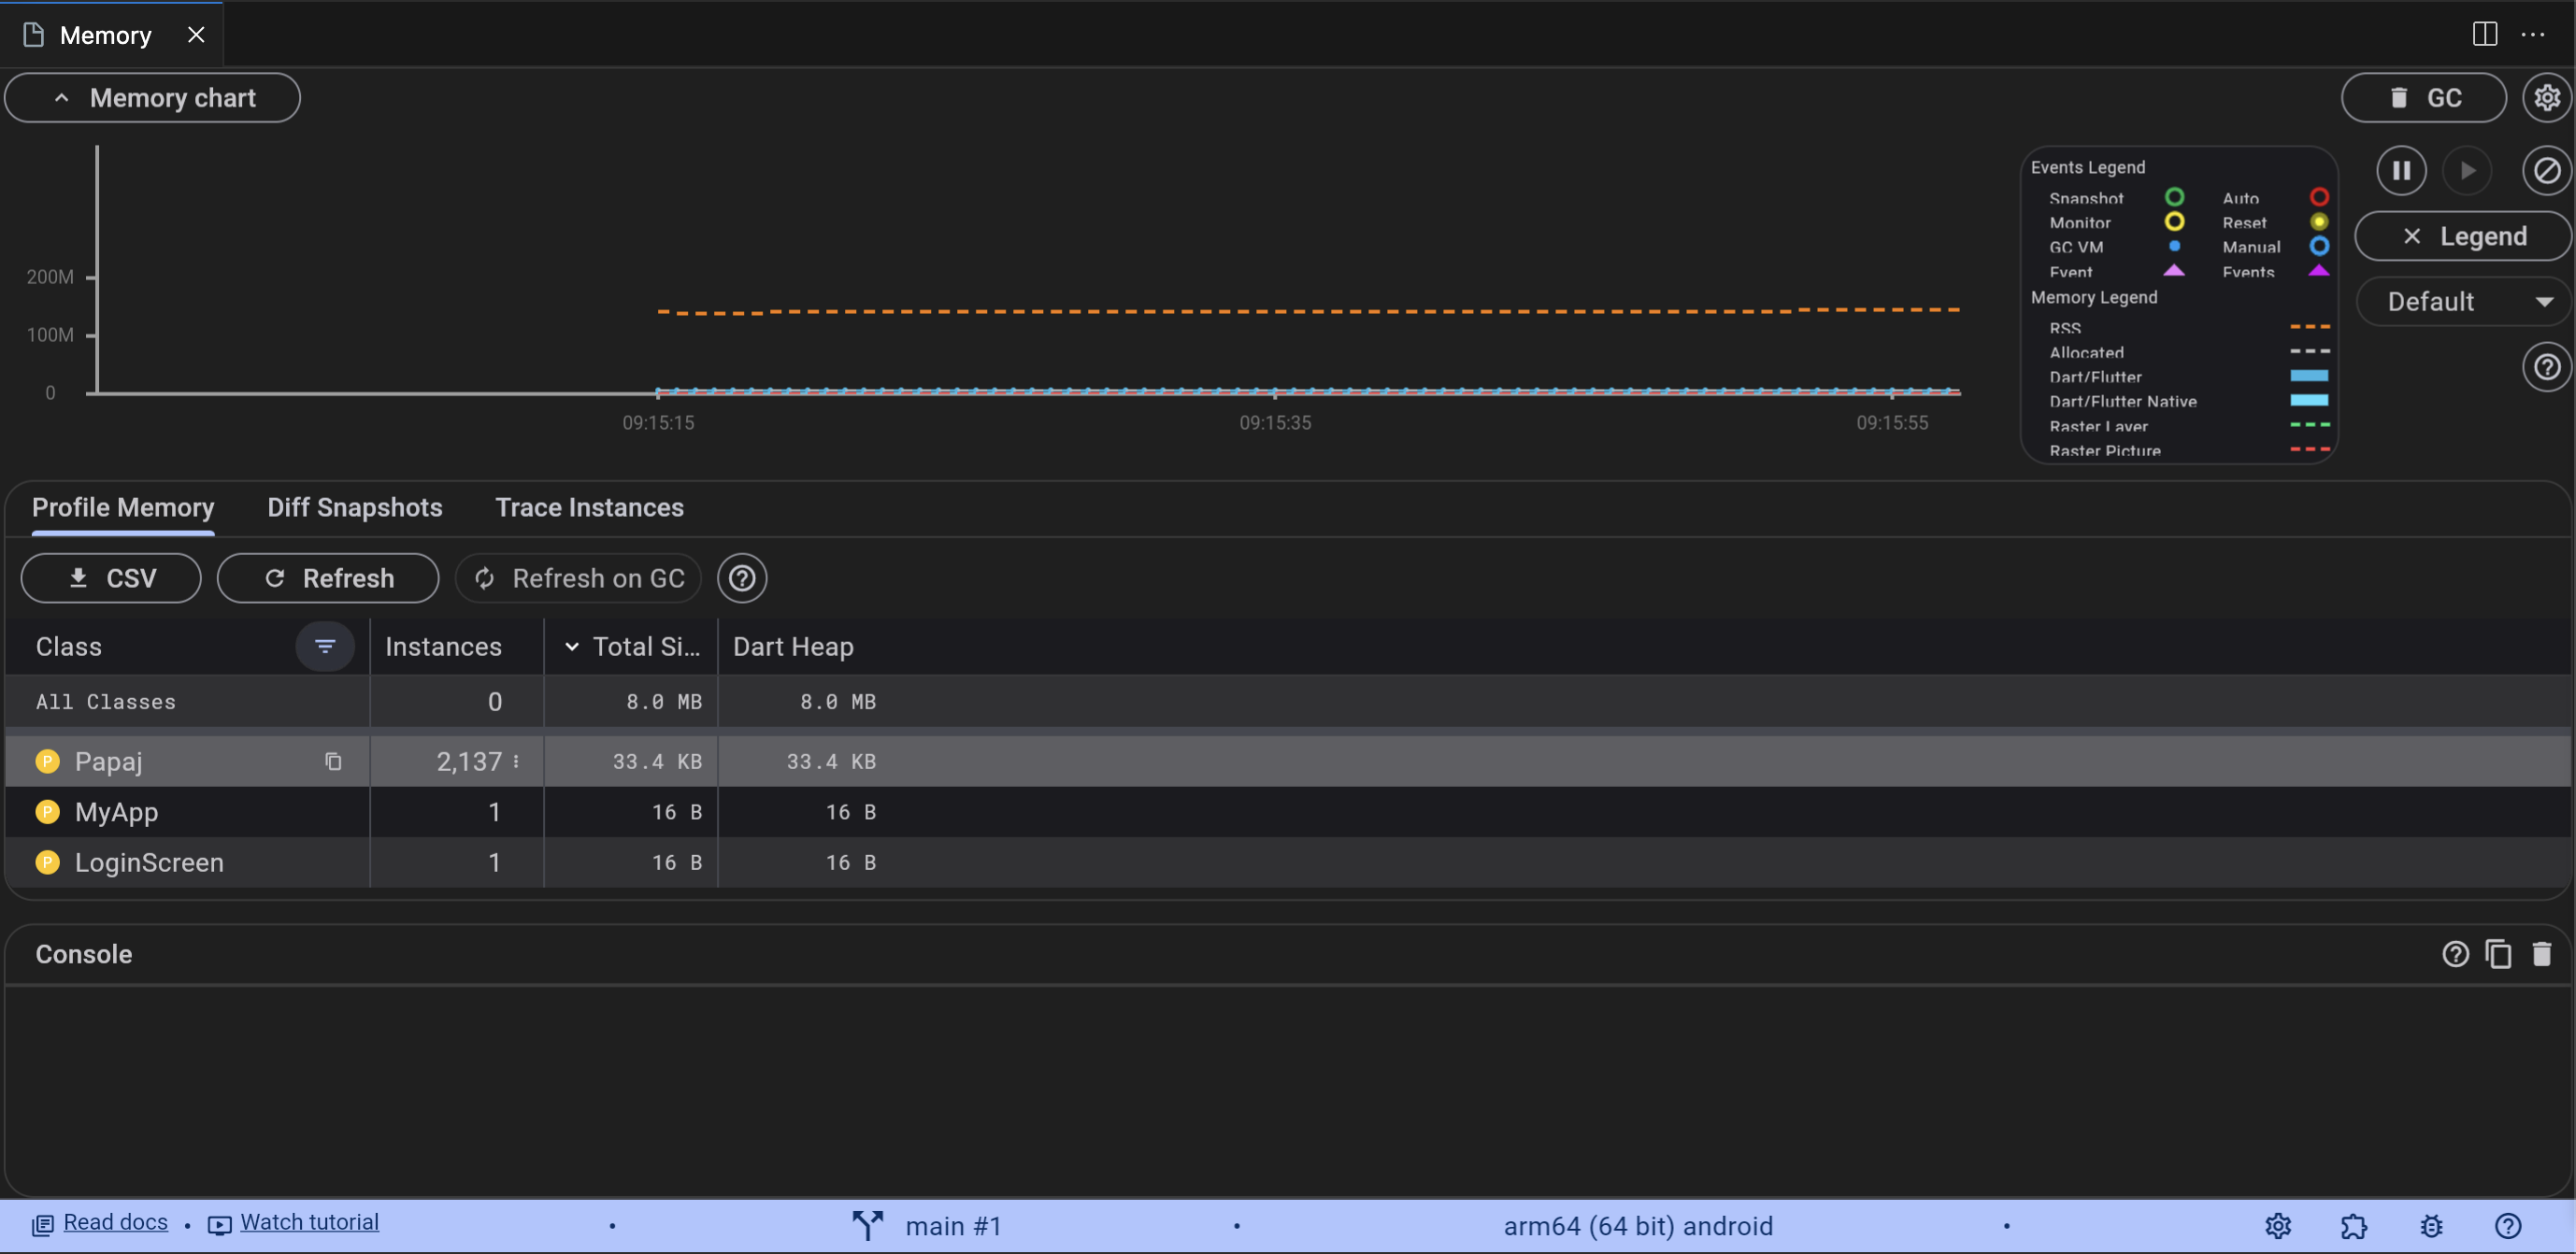
The “Memory” tab in Flutter DevTools pertains to RAM memory, not disk memory. It monitors the usage of operational memory by the application, showing which objects are stored in memory, when they are created and removed, and how much memory they consume. This is a crucial tool for identifying memory management issues such as memory leaks.
- Profile Memory: This tab allows real-time monitoring of memory usage by the application through a chart that illustrates changes in memory usage over time. Additionally, it provides the option to manually invoke the Garbage Collector (GC) to release unused memory.
- Diff Snapshots: The “Diff Snapshots” feature enables the comparison of two different memory snapshots. It helps identify objects that have been added, removed, or modified between two different points in time. This is a valuable tool for detecting memory leaks or other memory management issues.
- Trace Instances: The “Trace Instances” tab allows real-time tracking of instances of a specific object type. It provides insight into when and where these instances are created and removed, aiding in understanding how the application manages memory in relation to a particular object type.
Network
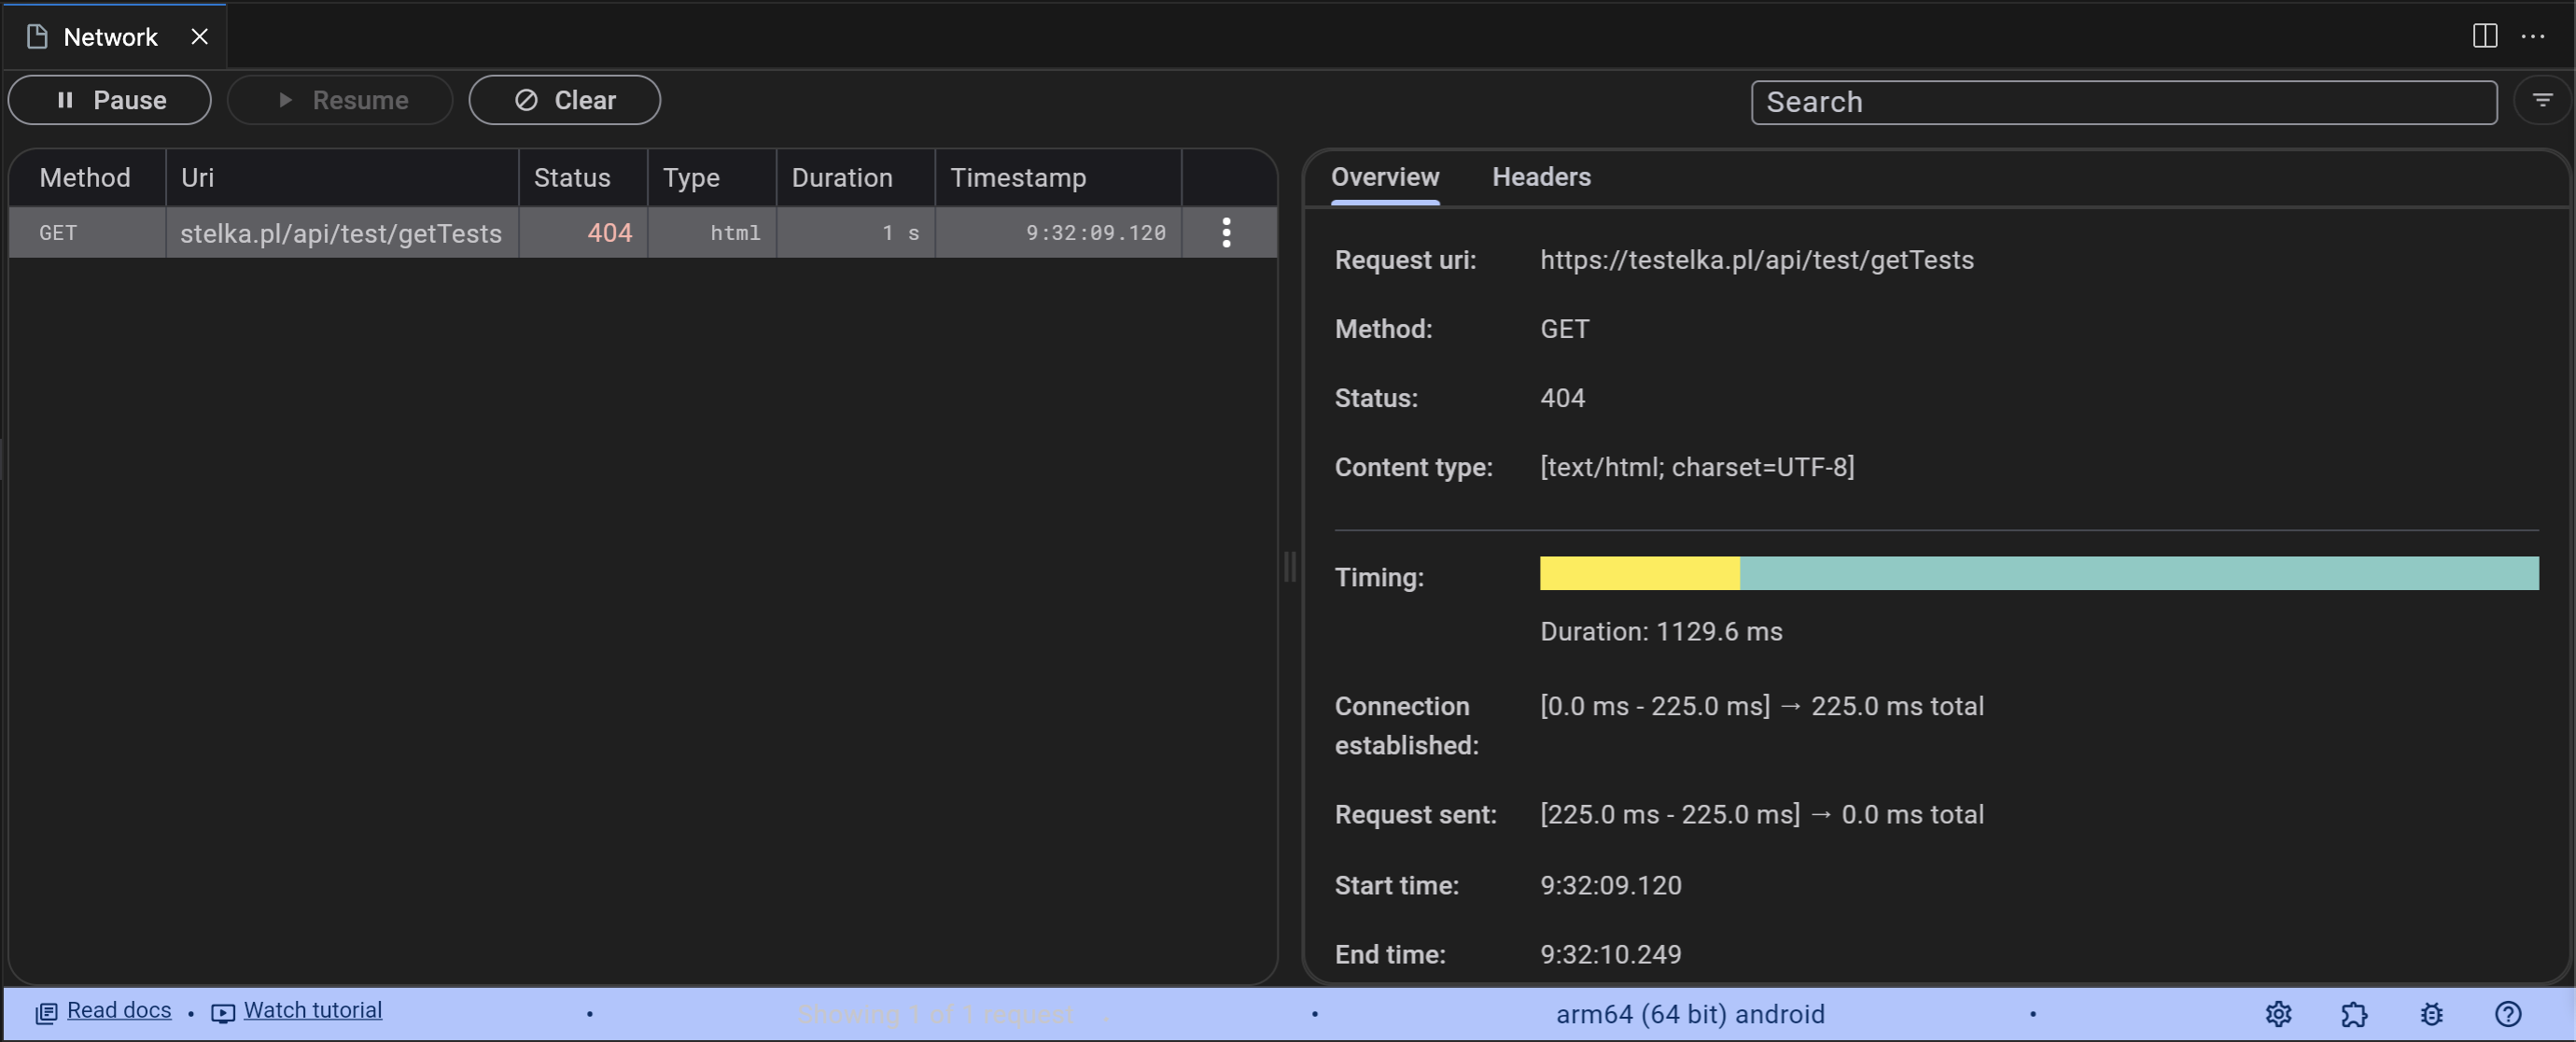
The “Network” tab in Flutter DevTools is designed for monitoring and analyzing network traffic generated by the application. Here’s what you can obtain from this tab:
- Network Traffic Chart: A chart displaying the amount of data sent and received by the application over time. This allows for the identification of network traffic patterns and potential network performance issues.
- List of Network Requests: A list of all network requests sent by the application, along with details such as URL, HTTP method, response status, duration, and the data sent and received. Clicking on each request provides more detailed information.
- Request Details: Upon selecting a request from the list, you can view additional details, including request and response headers, request and response bodies, and the duration of the request.
The “Network” tab is highly useful for debugging network-related issues, such as network request errors, network performance problems, or incorrect data being sent or received by the application.
Logging
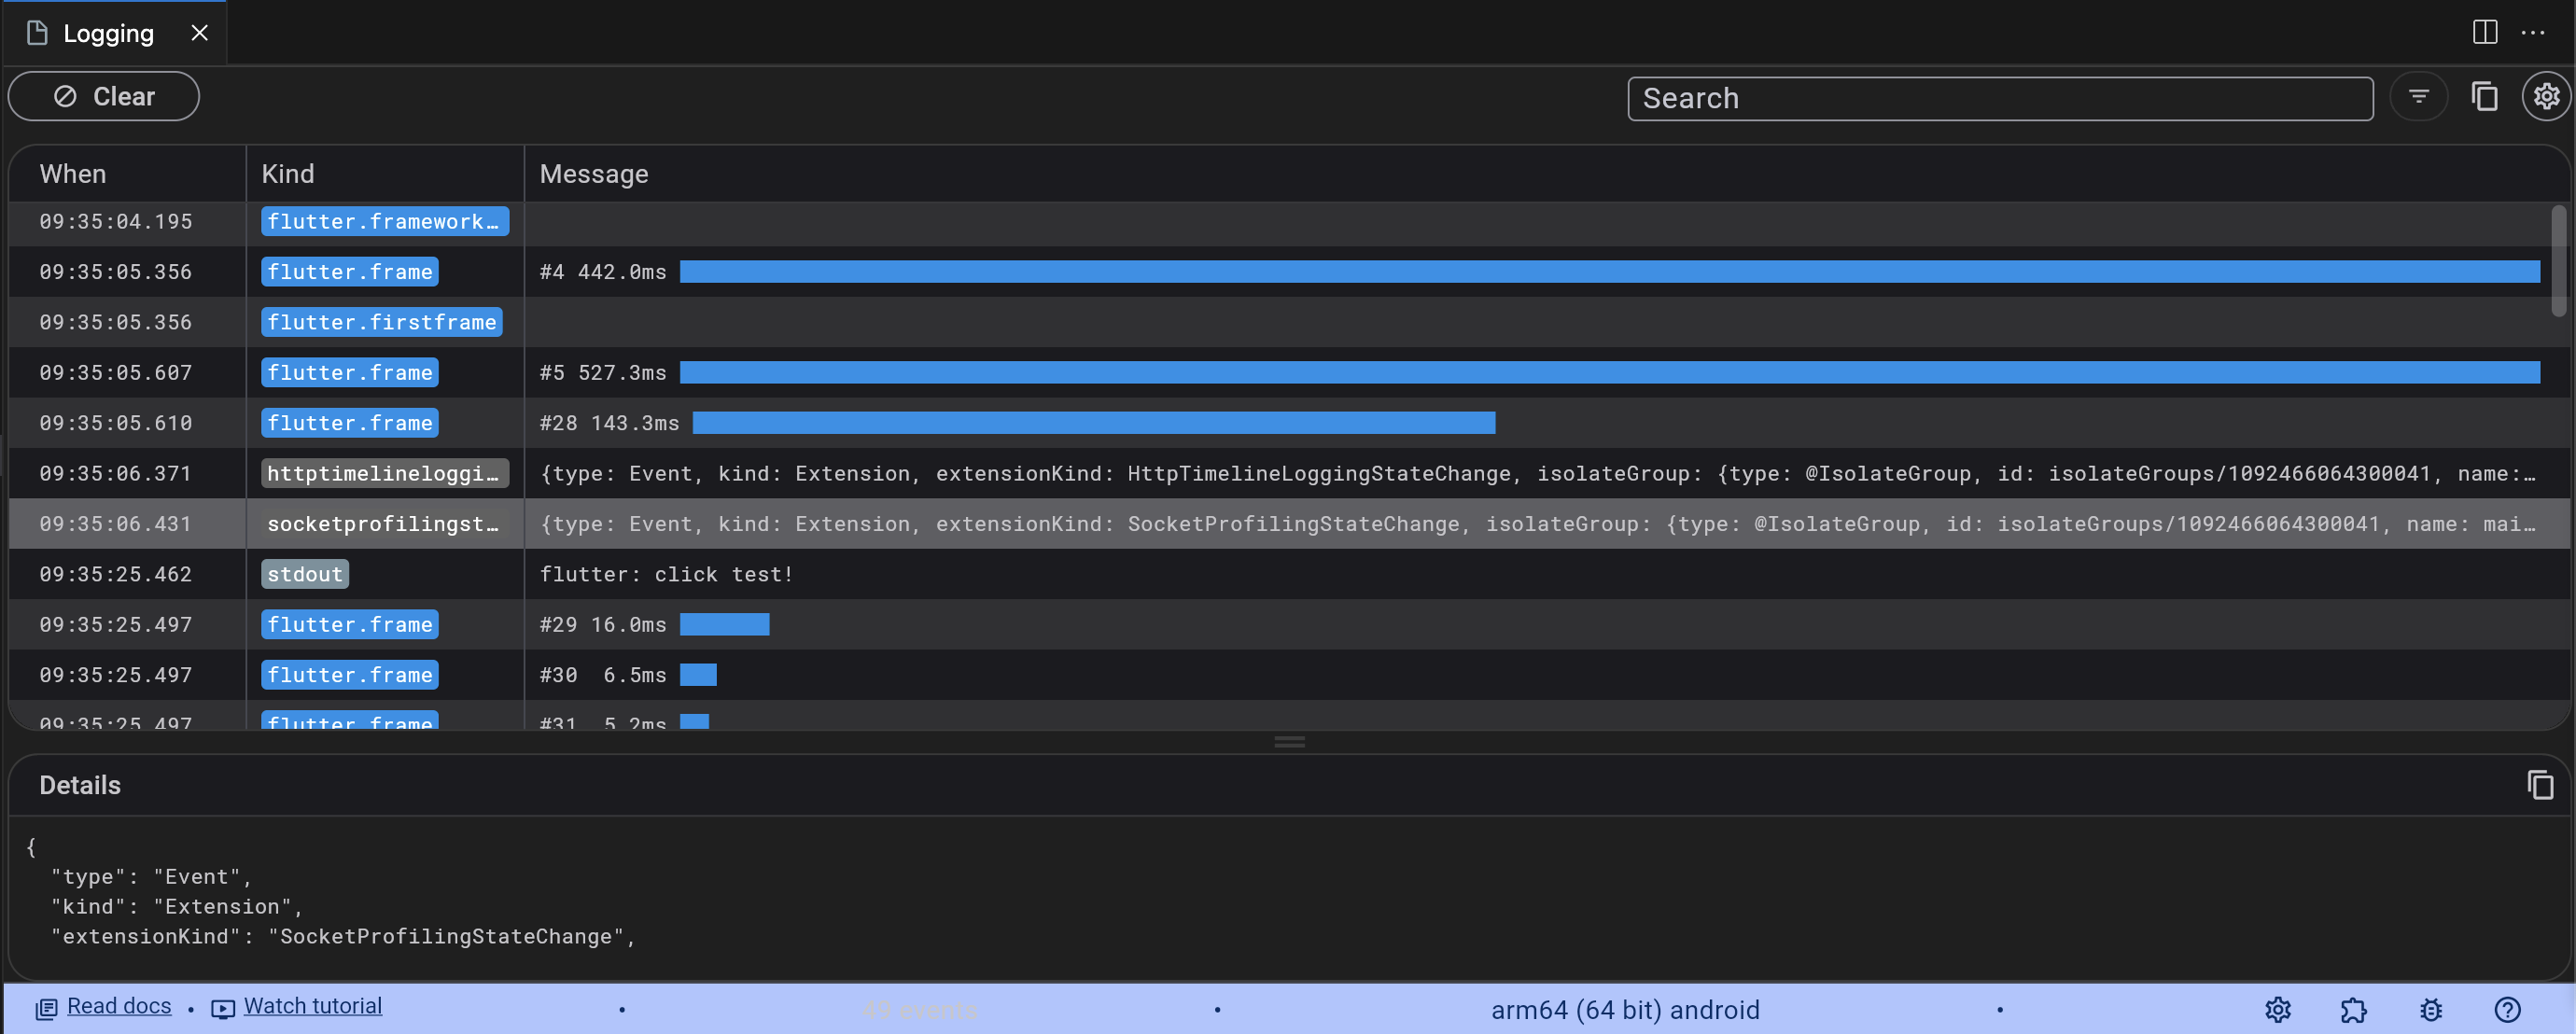
The “Logging” tab in Flutter DevTools is used to display logs generated by the application. Logs can contain various information such as errors, warnings, application operation details, diagnostic data, etc. Here’s what you can do in this tab:
- Browse Logs: All logs are displayed in a list, with the latest at the bottom. Each log includes information about the timestamp, severity level (e.g., error, warning, info), category (e.g., system, network, database), and the message.
- Filter Logs: You can filter logs based on severity level, category, or message content, allowing for the quick identification of logs of interest.
- Log Details: Clicking on a log allows you to view more details, such as the full message, call stack, etc.
The “Logging” tab is highly useful for debugging application issues, analyzing its behavior, or monitoring its state.
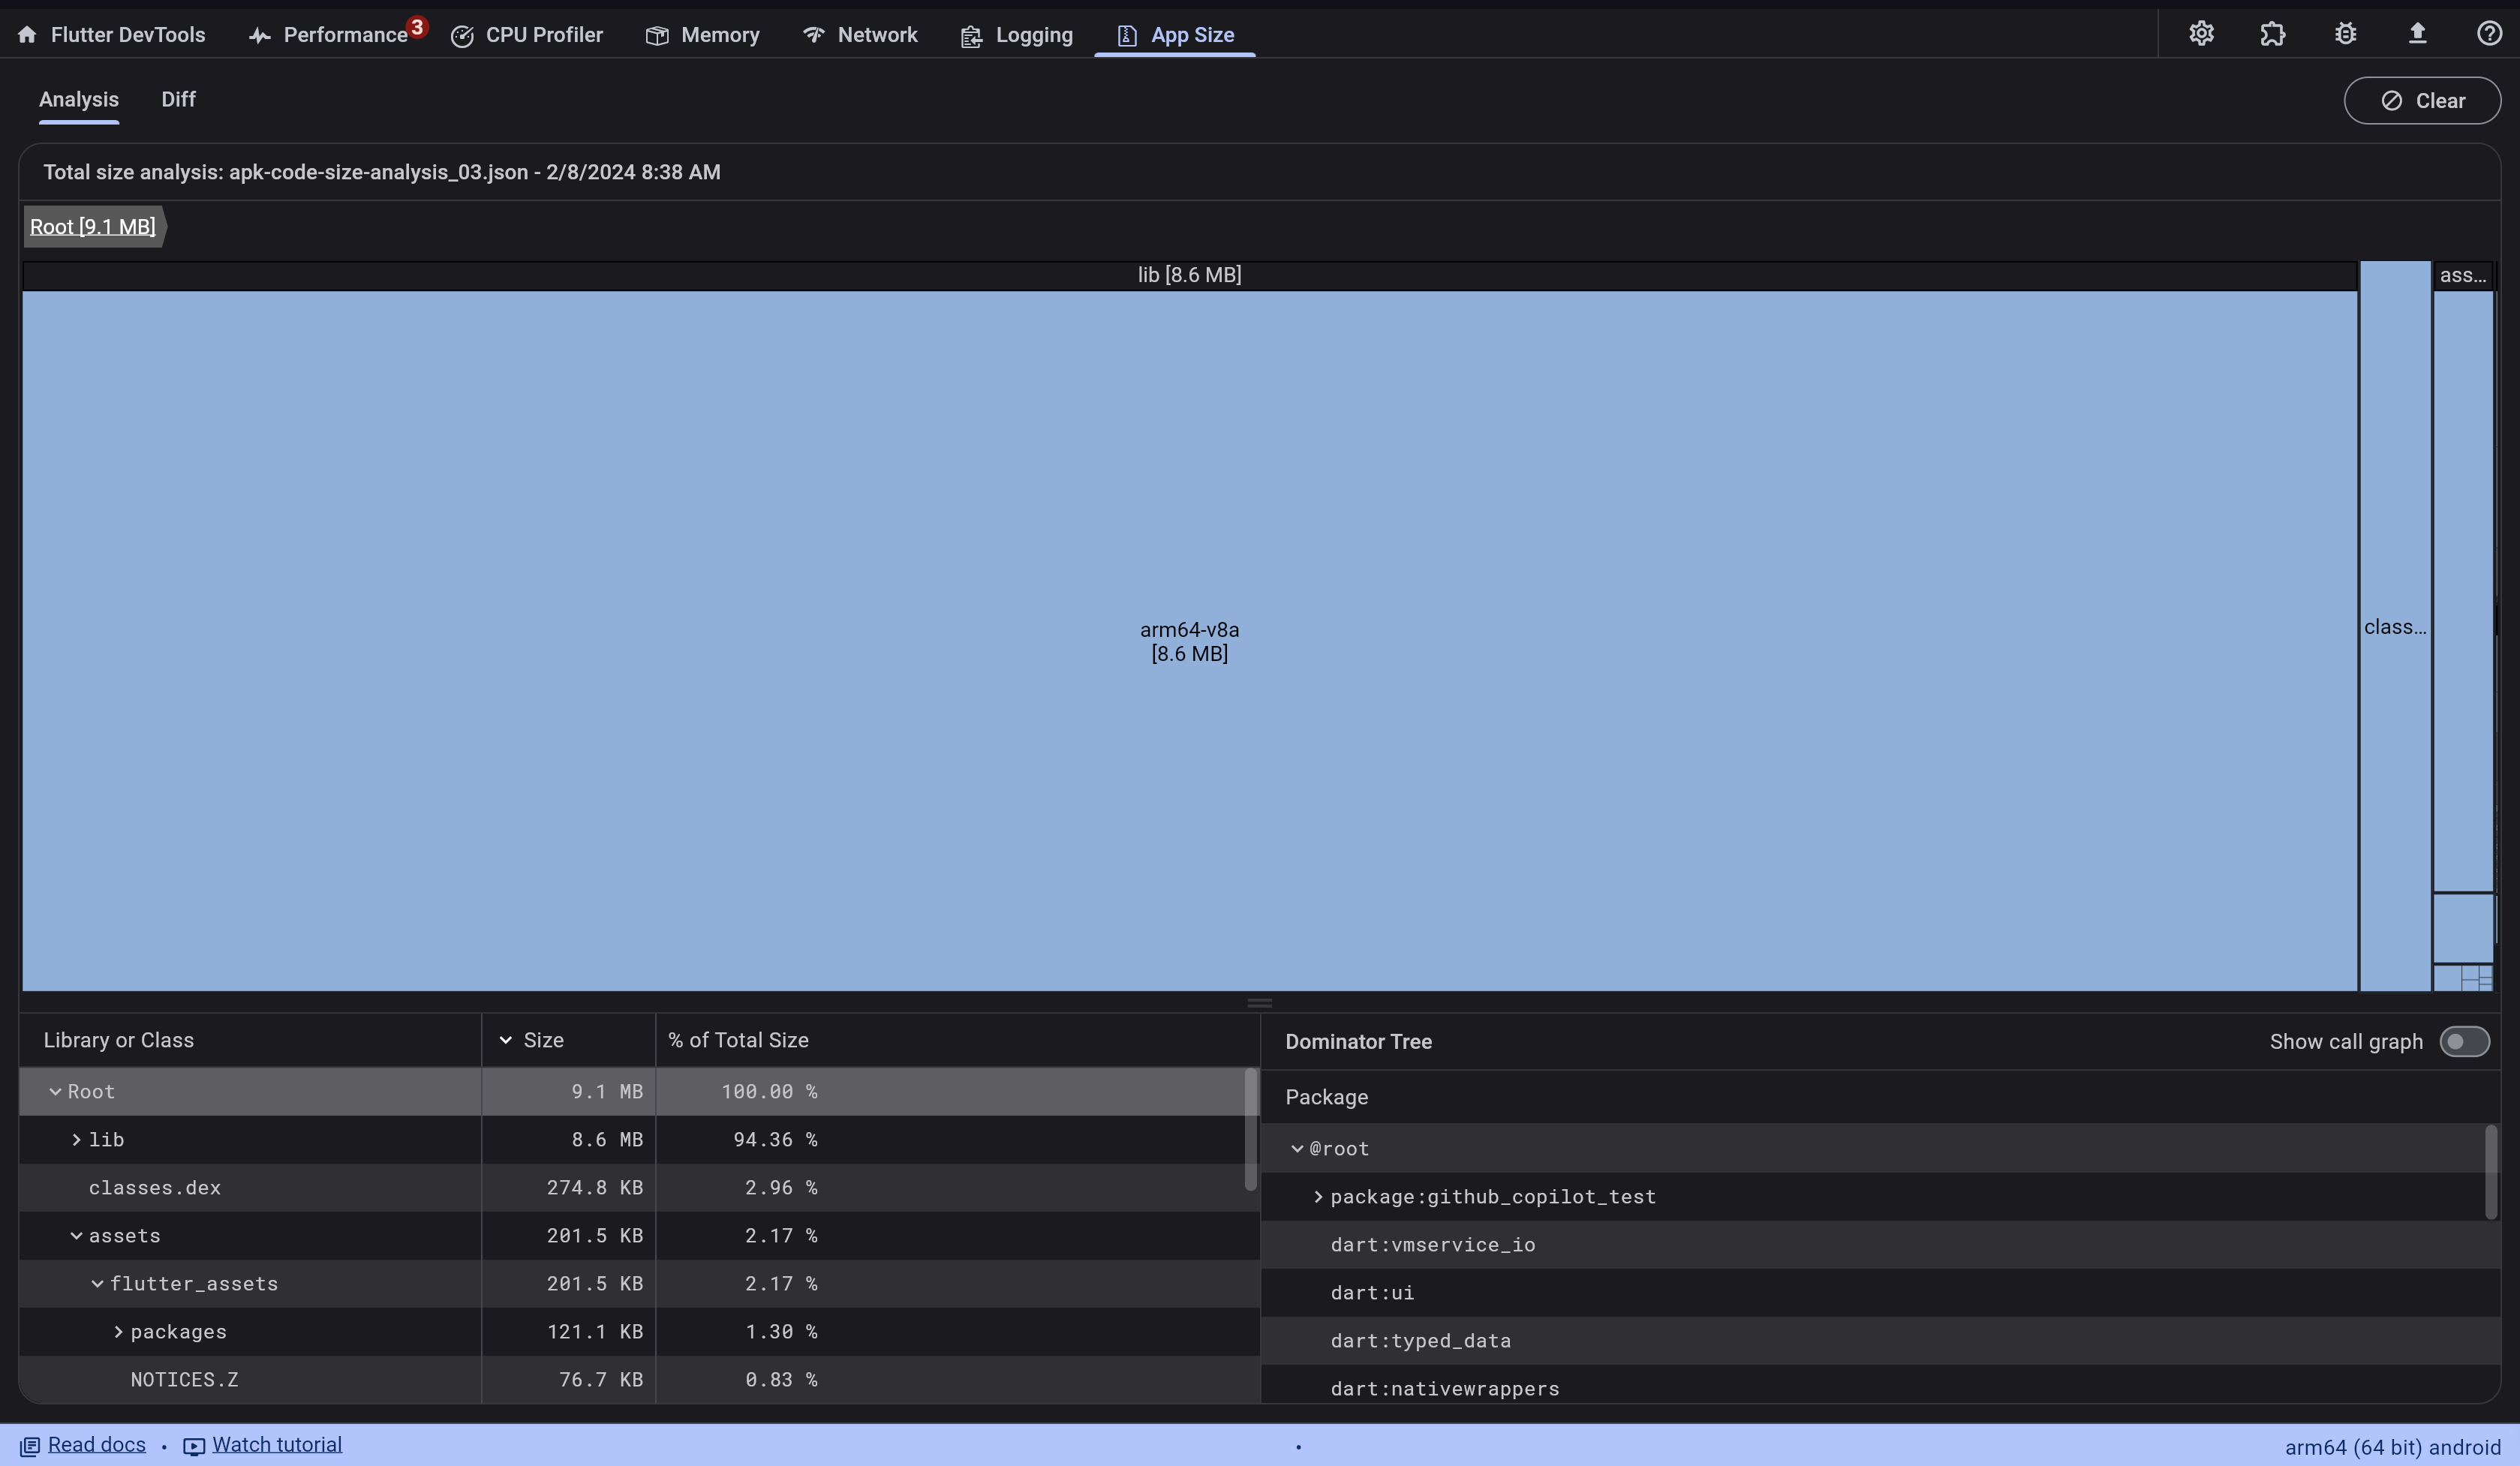
App size
his tool is used to check how much disk space the application occupies. To analyze this, it is necessary to generate a file with a breakdown of space usage.
The file is generated using the command:

Example:
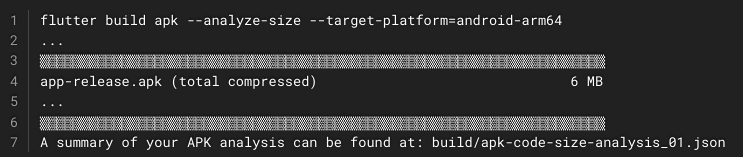
We transfer the file to DevTools, where it is processed, and information about the disk space occupied by various elements of the application is displayed.
Summary
Flutter DevTools is a true superhero in the world of Flutter! It is a set of diagnostic tools that transform the process of debugging and profiling applications into an exciting learning experience. Thanks to this tool, we can easily delve into what’s happening “under the hood” of our application, identify and resolve issues, optimize performance, and even understand how our application communicates with the network. It is an invaluable tool that makes working with Flutter even more exciting and productive.